In the age of the Industrial Internet of Things (IIoT), protocol gateways have come to play an important role in converting protocols between management systems and field devices when data is being collected. However, troubleshooting these protocol gateways is often a dreaded task for an engineer. The crux of the problem is that engineers are not familiar with the multitude of protocols commonly dealt with in a variety of applications. As a result, engineers often spend a lot of time and effort on the configuration and maintenance of devices. It is especially when a network breaks down and a quick solution evades them that engineers find themselves at the end of their rope.
Getting Both Sides of the Gateway

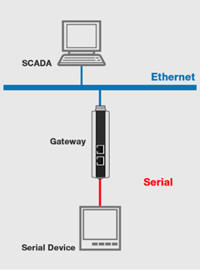
Understanding the topology of a standard network is essential to having a solid grasp of the mechanisms of the troubleshooting process. Nowadays, most management systems, such as supervisory control and data acquisition (SCADA) systems and Human Machine Interfaces (HMI), collect data through industrial protocols like Modbus TCP, PROFINET, and EtherNet/IP. These management systems connect to network infrastructure via a large number of switches. Protocol gateways, in their capacity as protocol converters, communicate with SCADA or HMI systems through Ethernet on one side; on the other side, they connect to field devices and communicate with fieldbus protocols through serial interfaces such as RS-232/422/485. Hence, the importance of gateways in data collection is beyond question.
When an issue occurs in a network, checking the devices should be done first, and can be done by inspecting the LED indicators, cable connections, pin assignments, and so on. If the networking hardware has no issues, then it is very likely a protocol communication problem. Unlike hardware issues, communication issues cannot be assessed by the naked eye—diagnostics tools are required. Without these tools, troubleshooting communication issues can be painstakingly tedious.
No Tools, More Trouble
When built-in troubleshooting tools in protocol gateways are unavailable, two issues make life very difficult for engineers: installing third-party software to capture Ethernet packets and capturing serial data.
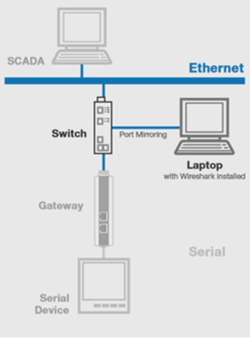
Wireshark, an open-source utility, is often used for low-end protocol gateways that don’t provide any troubleshooting tools of their own. In order to capture Ethernet data packets, the tool must be installed in the management system. However, for a number of reasons, Wireshark cannot be installed on all management systems. For example, some PLCs don’t have the ability to install third-party software, or security concerns may prohibit the installation of Wireshark in SCADA systems. To circumvent these roadblocks, engineers have to prepare a switch with a mirror-port function, which needs to be added between the gateway and the management system. Then, the mirror port must be configured to capture packets from the switch port that connects either to the gateway or the network infrastructure. Experienced engineers can then easily analyze the captured packets to determine the root cause. If they are lucky, the issue will be on the Ethernet side of the network, which can be solved quickly.

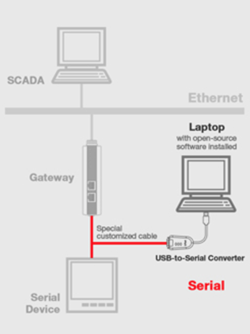
The same cannot be said for issues on the serial side of a network. Troubleshooting serial communication is tricky because it is difficult to capture serial data in the bus. When troubleshooting tools are unavailable, the only solution is to use a USB-to-serial converter connected to a special serial cable that must be created, requiring additional time and effort. These are then used to connect the serial device to the gateway, and a computer can then capture the data being transmitted by using a serial analyzer tool. Reading the data, however, is difficult because it is in a raw format.

This form of troubleshooting can be costly because of the additional parts and devices required, and the downtime required to analyze the raw data.
Let These Tools Do the Work for You
The good news is that most customer-centric protocol gateways give engineers a much-needed break by providing a choice of troubleshooting tools, namely protocol analysis, protocol diagnostics, and traffic monitoring.
The protocol analysis tool saves time by immediately indicating whether the issue has occurred on the Ethernet or serial side of a network. It also provides valuable tips on how to guide the troubleshooting process. These tips are a godsend for junior engineers, who have a very limited knowledge of the protocols being used.
The protocol diagnostics tool diagnoses the status of the protocol connection and records all errors, assisting users in determining the root cause of a network failure. Previously, when a connection failed, it was very hard to find the root cause without knowledge of what happened before the disruption.
The traffic monitoring tool helps troubleshoot communication problems by tracking traffic logs. These traffic logs can capture either Ethernet or serial data packets. Still, most of the logs display raw data, which has no value for most engineers. Therefore, an efficient traffic monitoring tool should be able to handle the logs and convert the raw data into a more meaningful format. By taking advantage of this tool, engineers can track the root cause easily.
Moxa's Solutions
Built-in troubleshooting tools, such as the communication tool, protocol diagnostics tool, and traffic monitoring tool, ensure that Moxa’s powerful gateways minimize downtime. These tools help complete the whole troubleshooting process by locating the issue on a network, checking the status of protocol connections, and monitoring traffic logs to track records. This means there is no need for engineers to waste time on figuring out what caused the downtime and can get right to work on fixing the issue instead. For more information, download the white paper: How to Easily Troubleshoot Protocol Gateways